

Overview
What each figure on the Overview screen shows and how to filter by period and by agency.
The Overview is the first screen of the master dashboard. It sums up license sales, your agencies’ sales and your share of each.
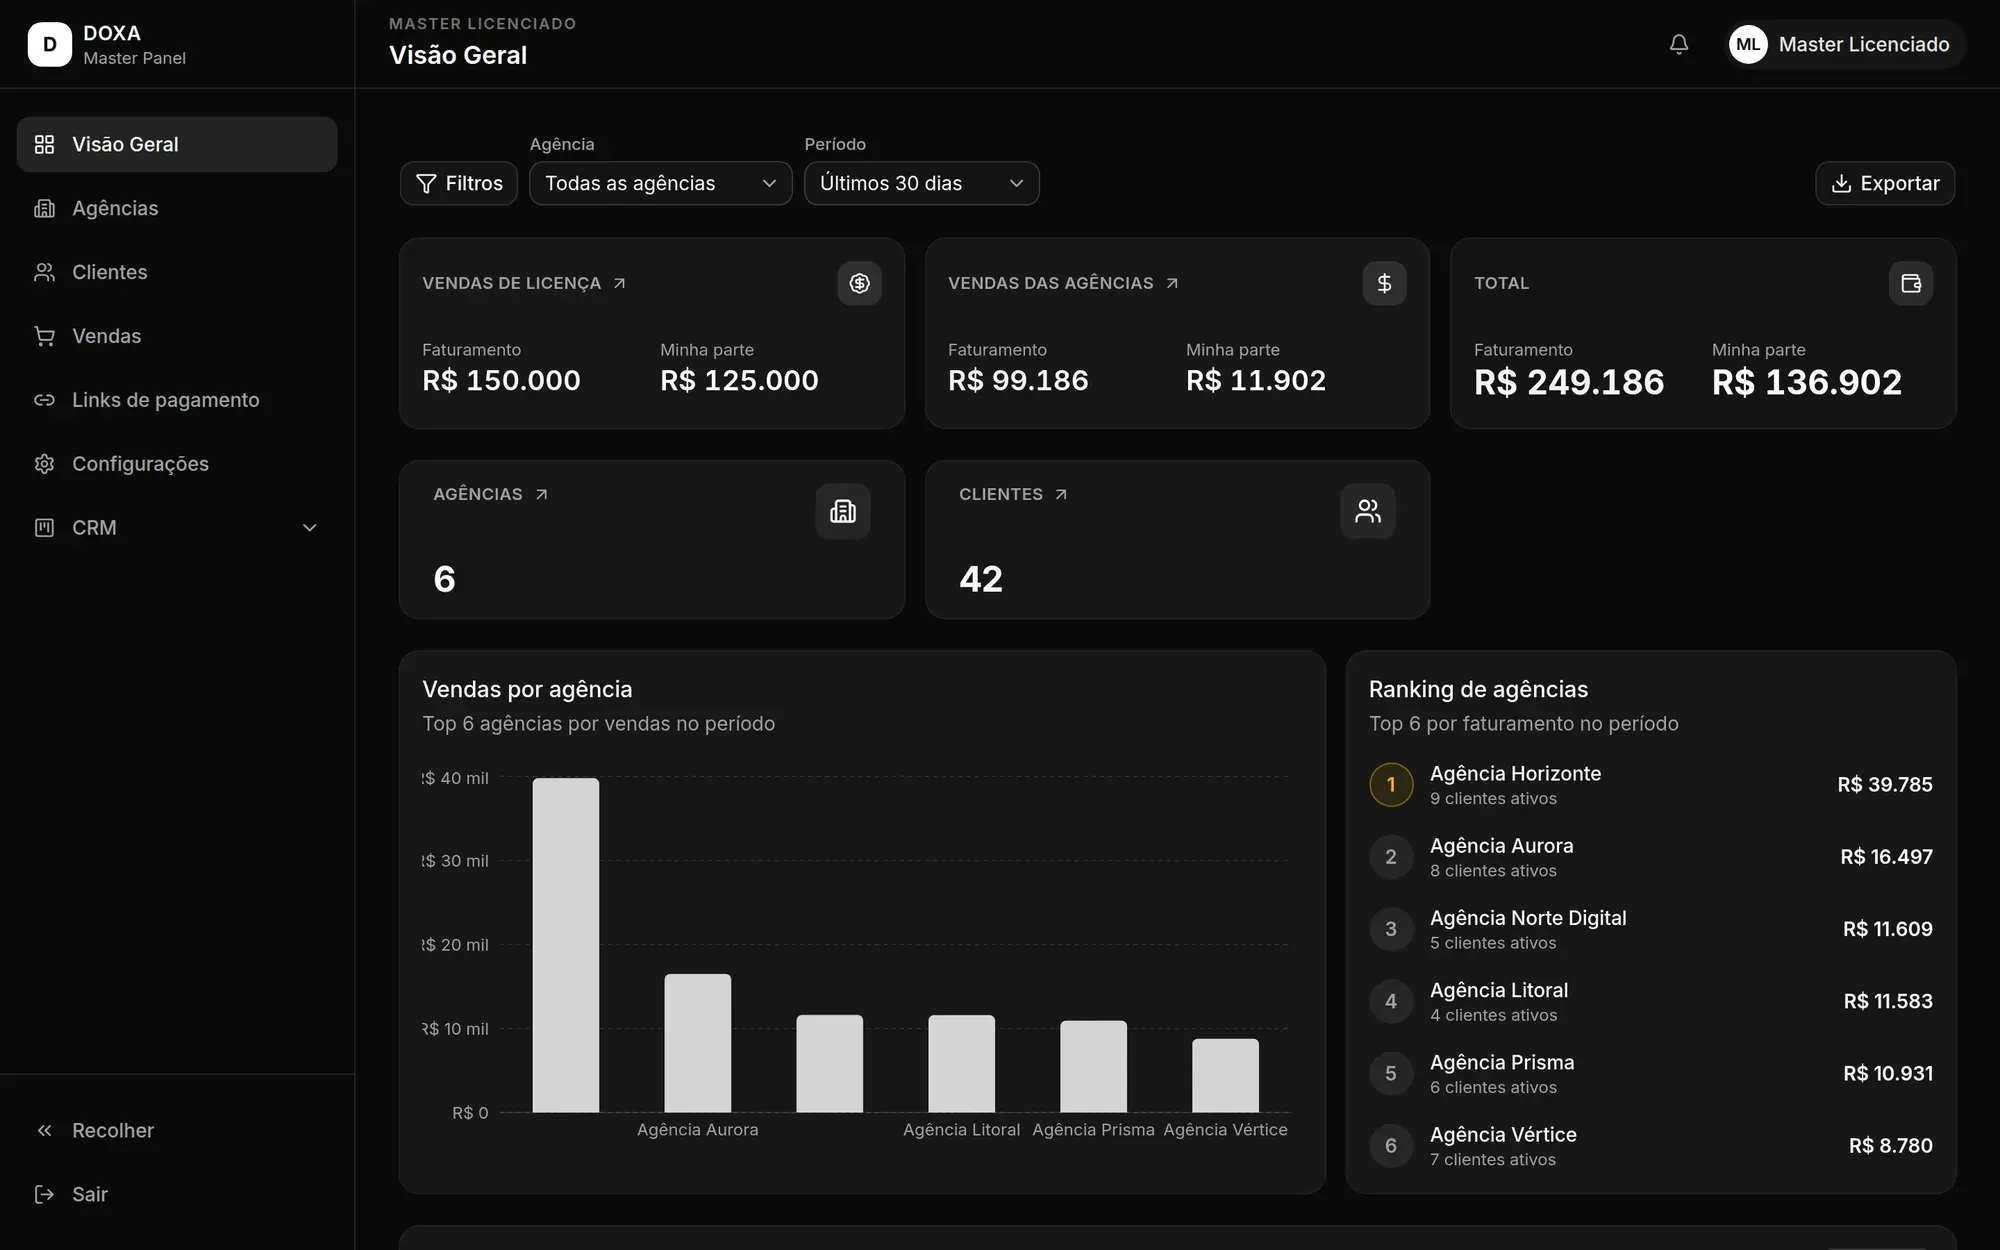
Filters
Section titled “Filters”At the top of the screen you choose:
- Period: Last 7 days, Last 30 days, Last 90 days or Last 12 months.
- Agency: All agencies or a single agency.
You can combine both filters. With an agency selected, every figure on the screen shows that agency only.
Sales and your share
Section titled “Sales and your share”Three cards each show the Revenue and My share:
- License sales: what you received for the licenses sold in the period. An instalment sale counts by what was paid within the period, not by its full amount.
- Agency sales: what your agencies sold to their clients in the period. My share is your commission on those sales.
- Total: the sum of the two cards above.
Click License sales or Agency sales to see how the figure breaks down, sale by sale or agency by agency.
Agencies and clients
Section titled “Agencies and clients”The Agencies and Clients cards show how many agencies are under your license and how many clients they have. Click either one to open the matching screen.
Chart and ranking
Section titled “Chart and ranking”- Sales by agency: the 6 agencies that sold the most in the period.
- Agency ranking: the 6 agencies with the highest revenue in the period, with each one’s number of active clients.
Licensed agencies
Section titled “Licensed agencies”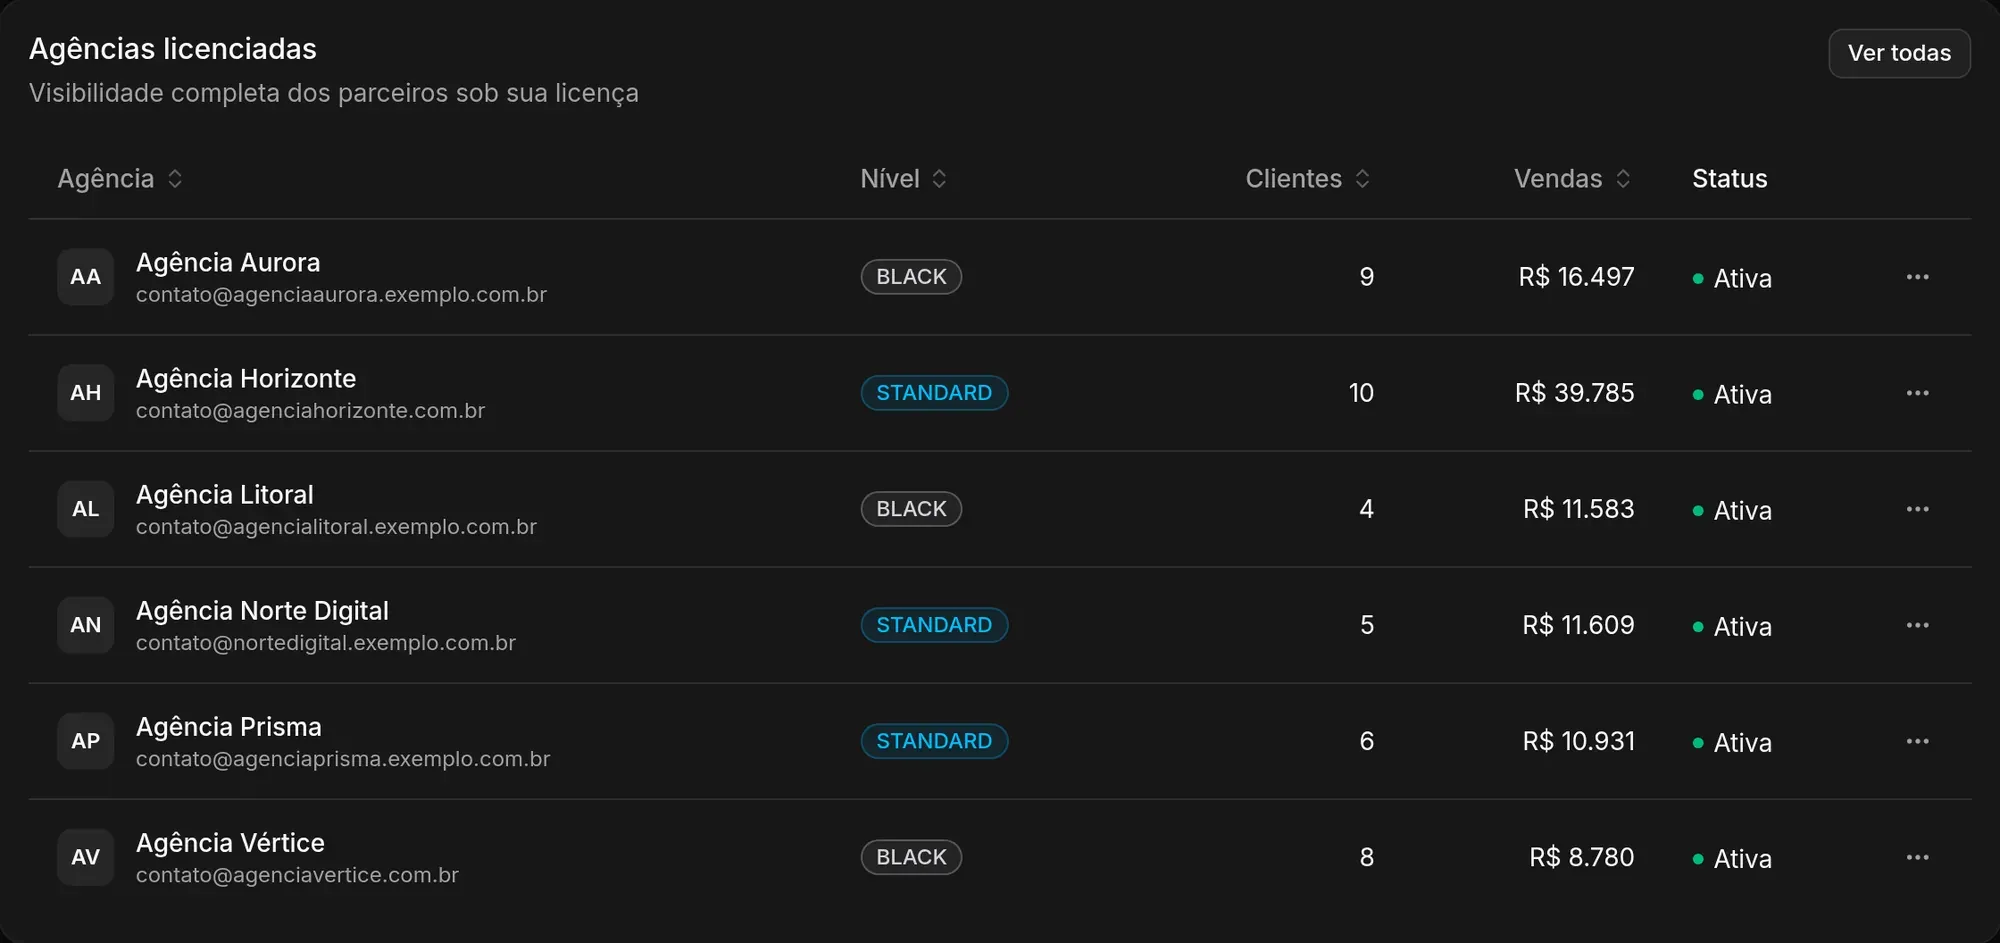
At the bottom of the screen is the Licensed agencies table, with each agency’s Tier (its plan), Clients, Sales and Status for the selected period. To see more about each agency, use the Agencies screen.